Remote Developer Tools and Firefox for Android
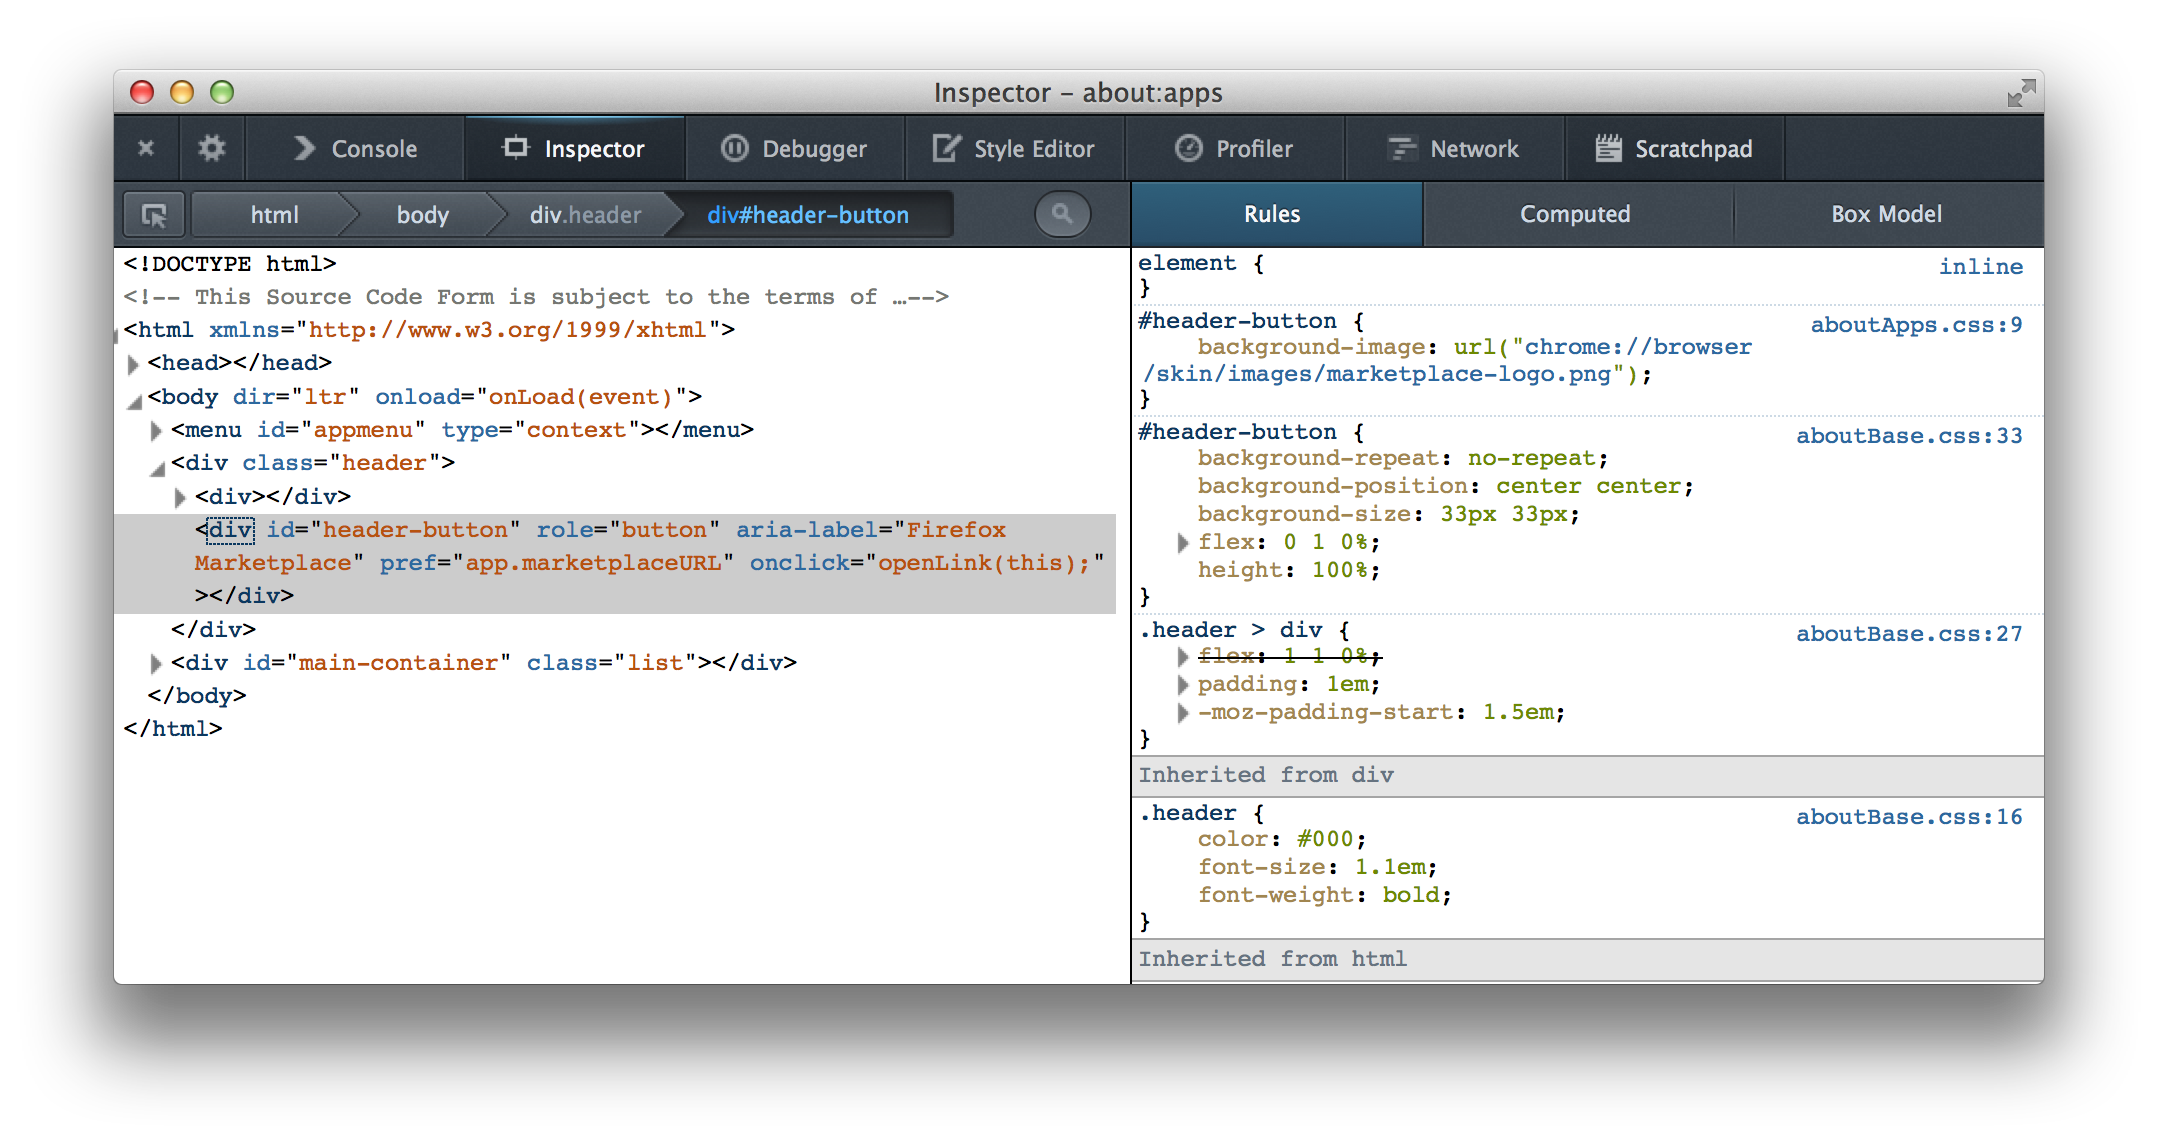
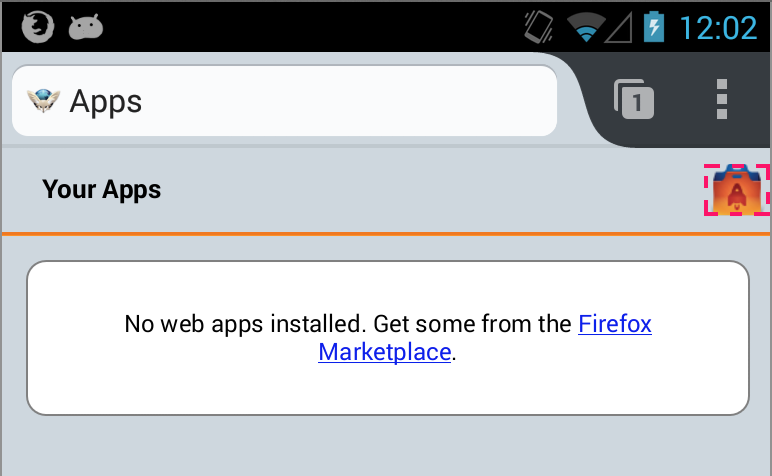
A lot of the Firefox for Android UI is written in Java, but under the hood there’s still quite a bit of JS that controls core browser logic. We also use HTML to create the content of most of our chrome-privileged pages, such as about:addons. Today I found myself working on a polish bug for about:apps. In the past, tweaking the CSS for these pages has been a pain, since testing changes required pushing a new APK to your device. However, I remembered that the remote inspector recently landed for Firefox 26, so I decided to try it out. Verdict: it was amazing!


Setting up the remote developer tools is as easy as flipping prefs on desktop and mobile (these prefs are now exposed in the UI!), running an adb command to set up port forwarding, and hitting a button. The directions are really well documented on MDN, so you should look there for more detailed instructions.
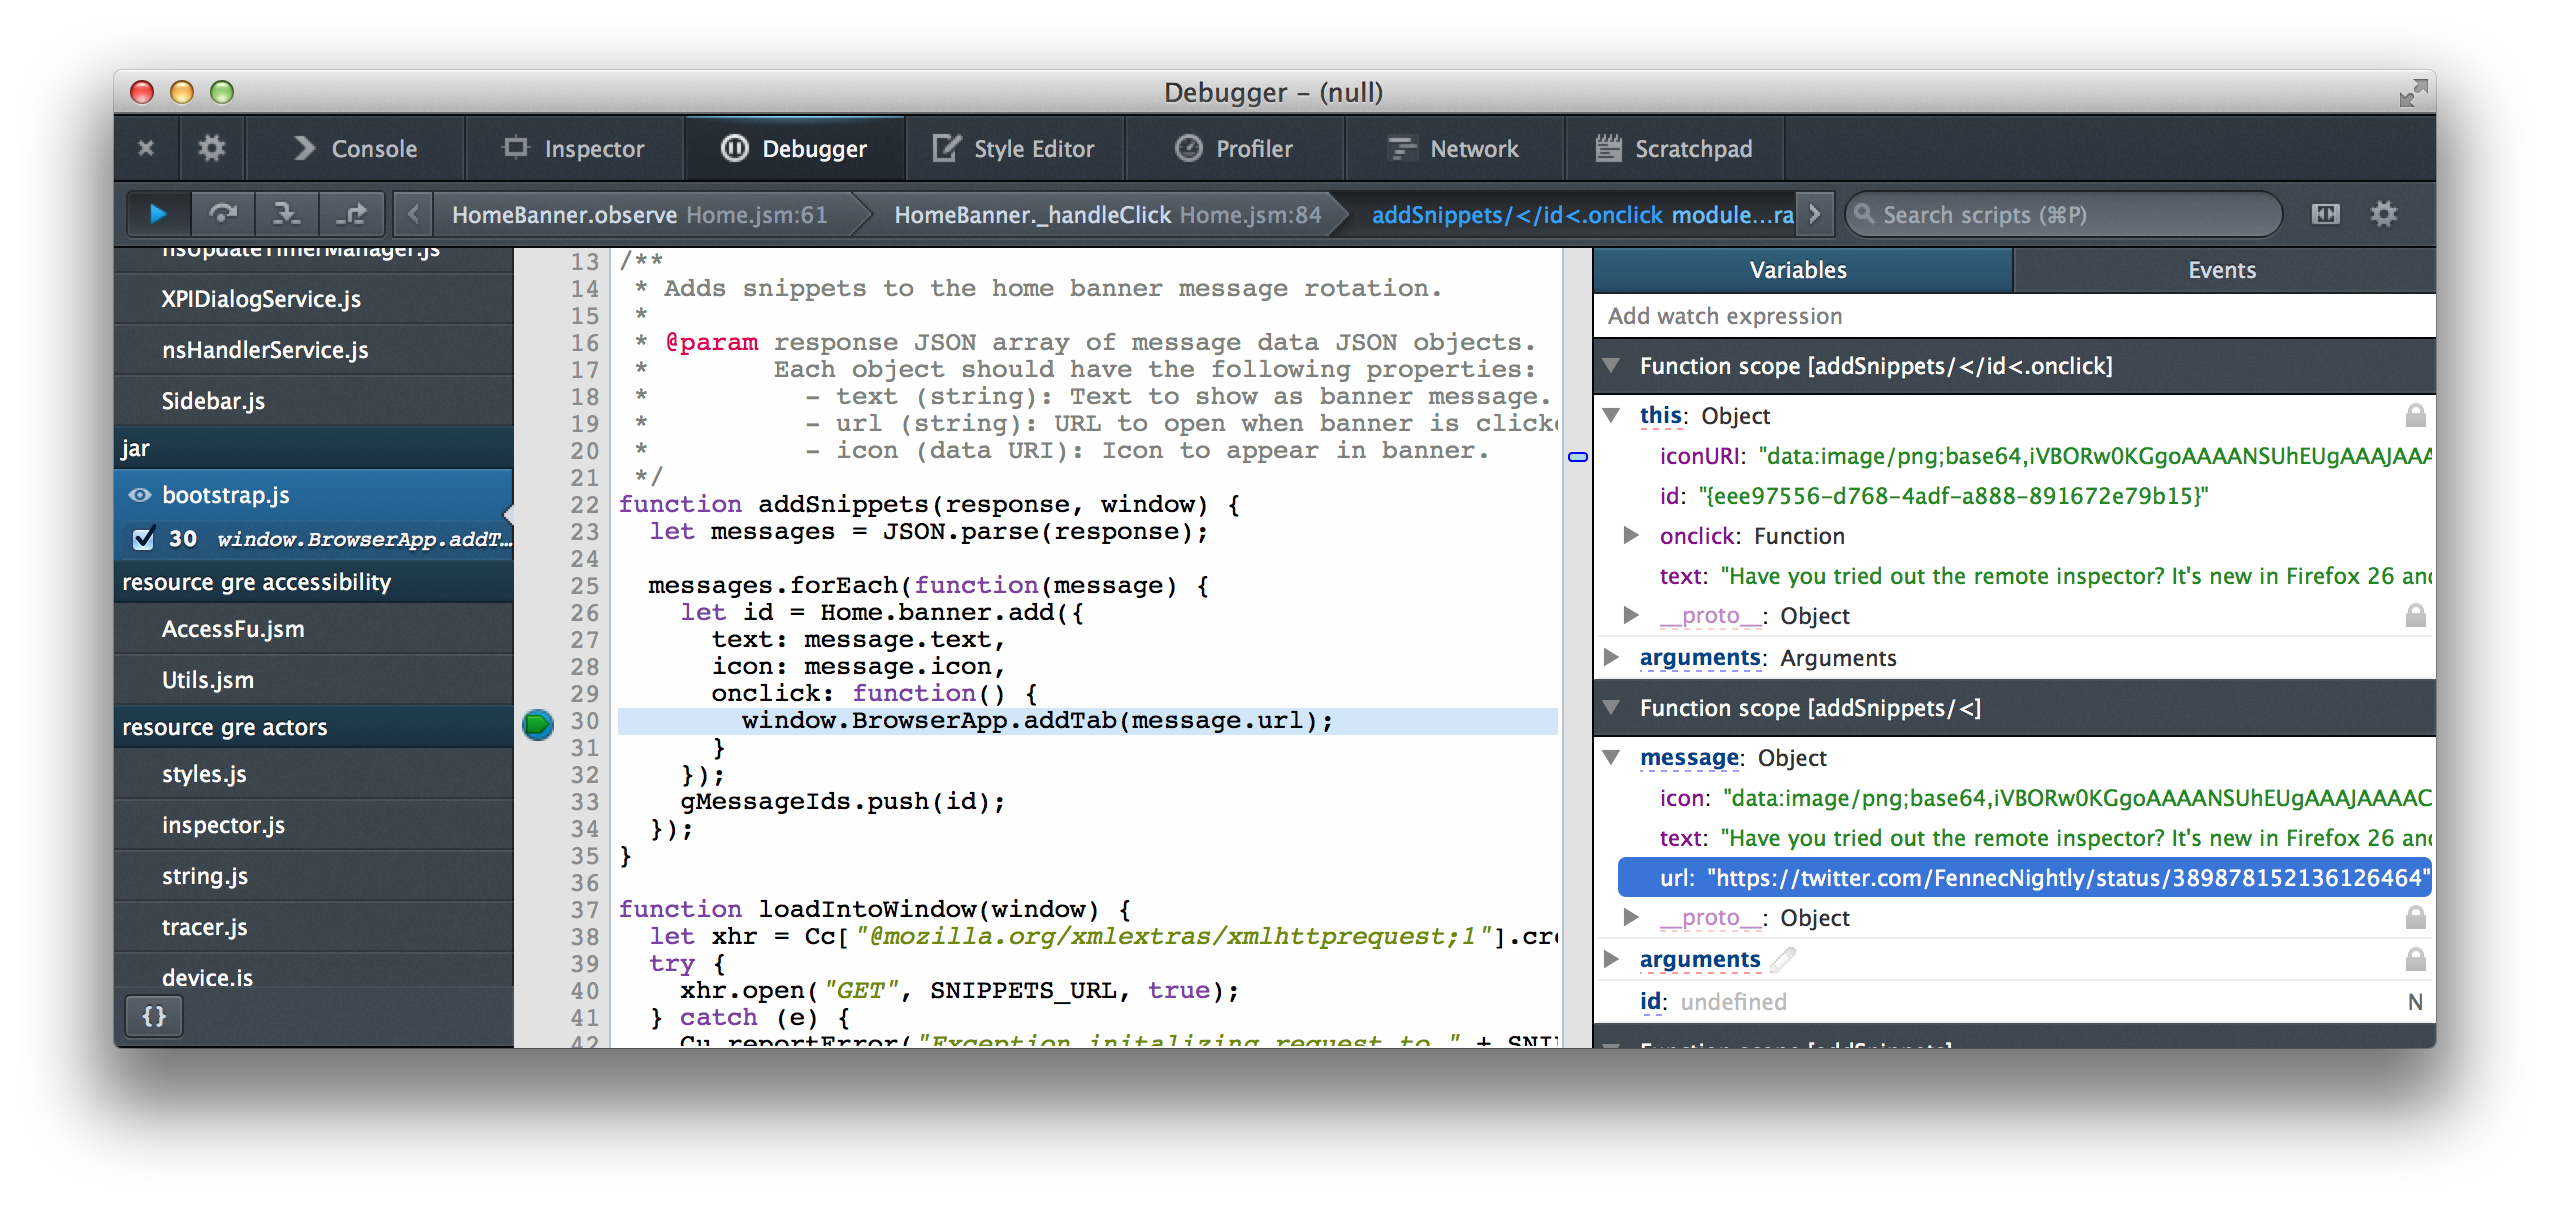
While playing around with the inspector, I also realized that remote chrome debugging is enabled for Firefox for Android. It wasn’t immediately obvious to me that in order to attach the debugger to the main chrome window, you need to select the “Main Process” link on the desktop “Connect to remote device page”, but once I did that, I had access to all of the browser chrome JS. And since add-ons for Firefox for Android are written in JS, this means that you can easily debug all of your add-on code!

Big thanks to the Firefox Developer Tools Team for doing so much awesome work. And I know they’re always looking for new contributors to help them out!